Stellar spectroscopy, the study and classification of spectra, was born early in the 19th century when the German scientist Joseph von Fraunhofer discovered dark lines in the spectrum of the Sun (see previous post). He later observed similar lines in the spectra of stars and noted that different stars had different patterns of lines. Following Fraunhofer, Angelo Secchi and others developed classification schemes in the 2nd half of the 19th century, which via the Draper system, Harvard system and MKK system led to today's MK system. We follow some of the history just for the fun of it, and to understand how the "O, B, A, F, G, K, M" alphabet came about.
Angelo Secchi and Merz spectrographs
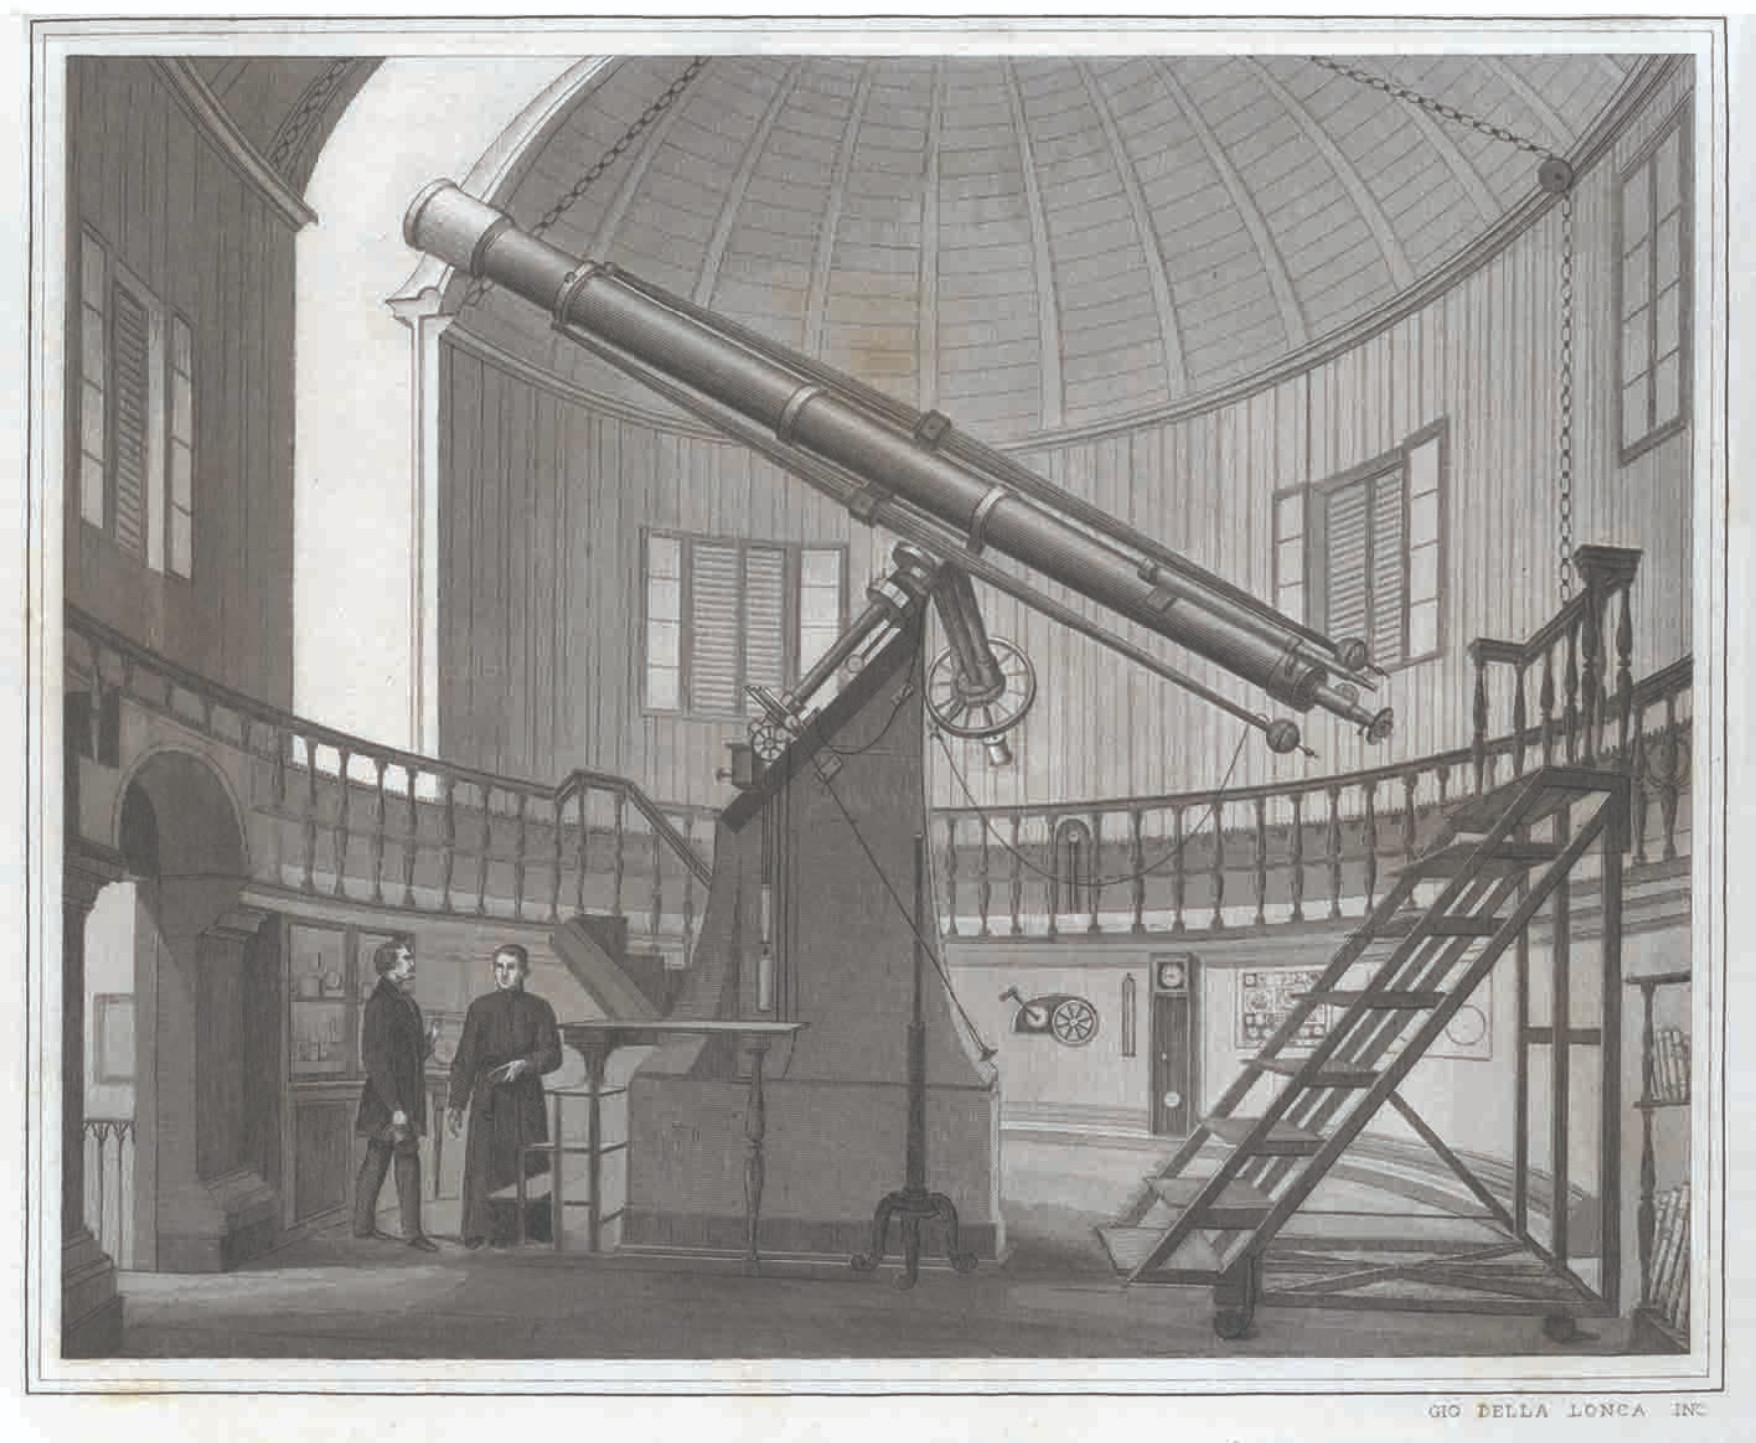
In 1866, Pietro Angelo Secchi, an Italian priest and scientist, noticed that the line patterns depended on the star’s color. Secchi began his training in the church and became a Jesuit priest. However, he abandoned this career in favour of physics, in which he had also been trained. In 1848 he travelled to the United States, where he had been offered a professorship in physics at Georgetown College near Washington. In 1850 Secchi returned to Italy, where he became director of the Roman College Observatory (Collegio Romano). His interests spanned meteorology, terrestrial magnetism, sunspots and the solar chromosphere, double stars and comets as well as spectroscopy. Within two years of his return to Rome, Secchi had founded a new observatory at the Collegio Romano, thanks to generous support from Pope Pius IX. The principal instrument was a 24-cm equatorially mounted refractor by Merz.
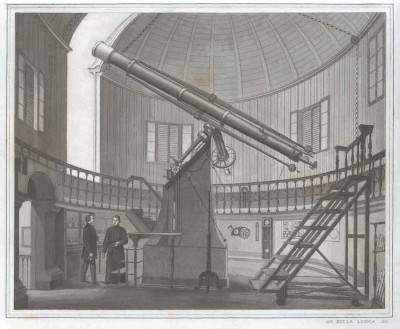
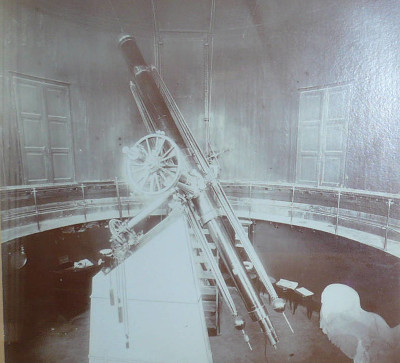
Figs. 1, 2: Merz equatorial telescope at the Collegio Romano Observatory. Fig. 3: Merz equatorial telescope of palermo astronomical observatory. The instrument was installed in 1865 and is identical to the one used by Secchi at the Collegio Romano Observatory.
Georg Merz had taken over the famous optical firm that Joseph von Fraunhofer (1787–1826) and Joseph Utzschneider (1763–1840) had established in Munich, and was continuing the renowned tradition of their optical institute. The Merzs rightfully considered themselves Fraunhofer’s successors and the keepers of his tradition in optics. They often requested information about new improvements, made by Secchi to one or another apparatus, in order to apply them to the instruments they were constructing; Secchi, on the other hand, used to send suggestions to the Merzs, by his own initiative. The most important partnership between Secchi and the Merzs concerned the development of a spectroscopic apparatus for analyzing starlight.
In the second half of the nineteenth century numerous technical improvements in laboratory spectroscopes were devised, and some of these had a direct influence on the practice of astronomical spectroscopy. One of the improvements in prism spectroscope design in the mid nineteenth century was the use of more than one prism to give higher dispersion and resolving power. Another much used technique rested on the idea of increasing the dispersion, not by adding more prisms, but by passing the light through one or more prisms twice after reflecting it back on itself.
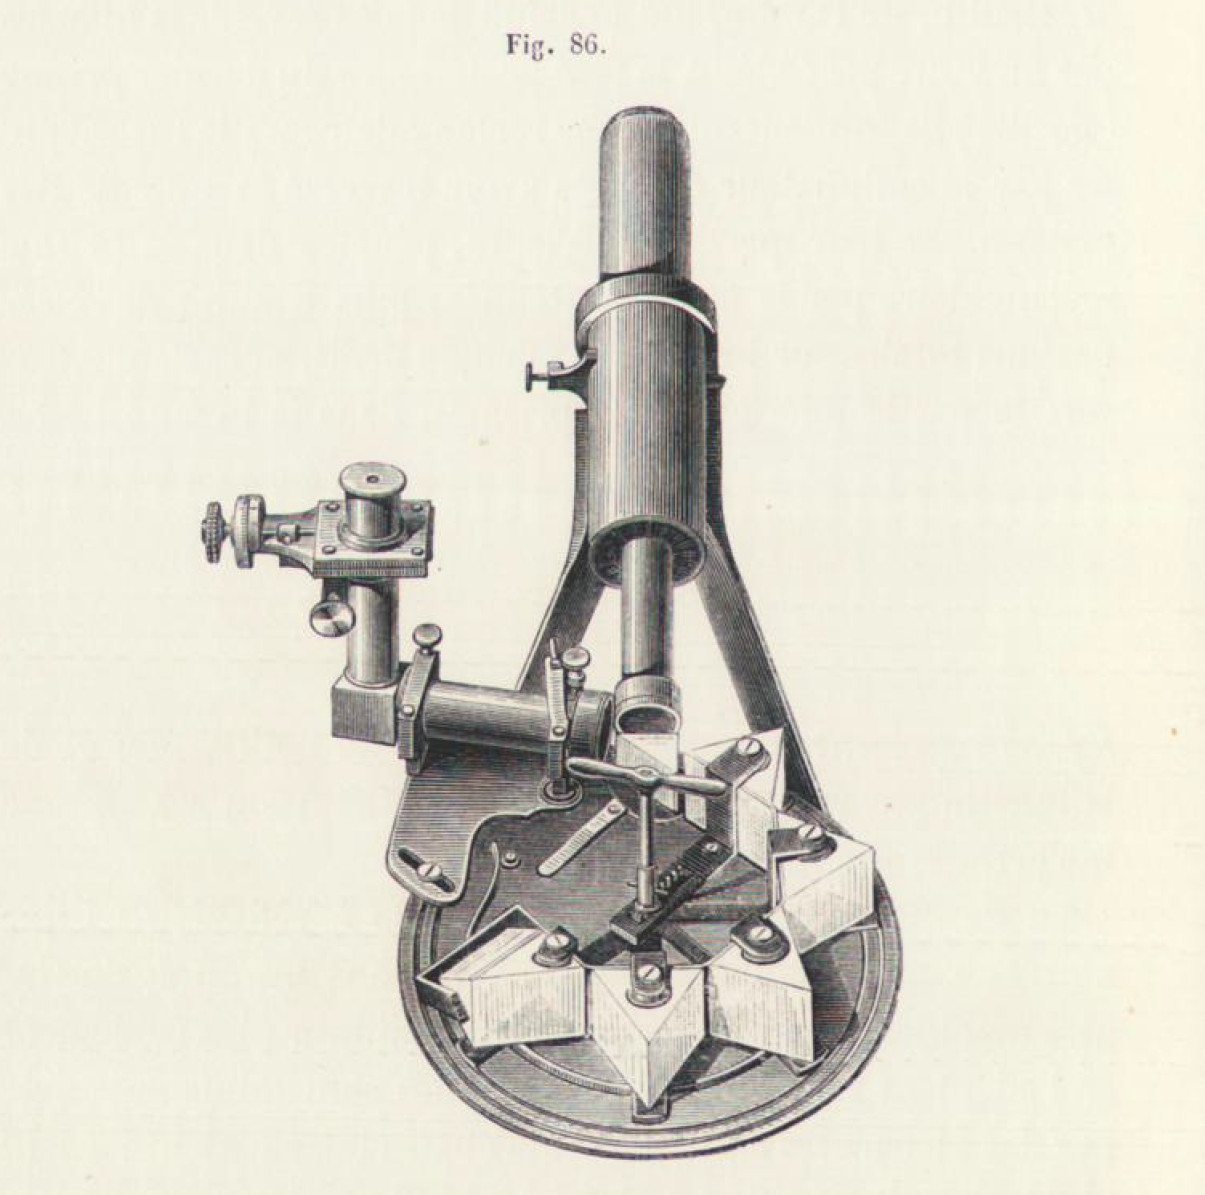
One method of achieving a double pass through the prisms was to fold the beam using a totally reflecting 90◦ prism at the end of the prism train. The return beam then went back through the prisms, but in a higher level (the prisms had to be twice the height), which therefore enabled the separation of collimator and viewing telescope. Secchi also acquired a high dispersion double-pass instrument, which comprised four and a half prisms for dispersion, each traversed twice in upper and lower levels (see Fig. 5).
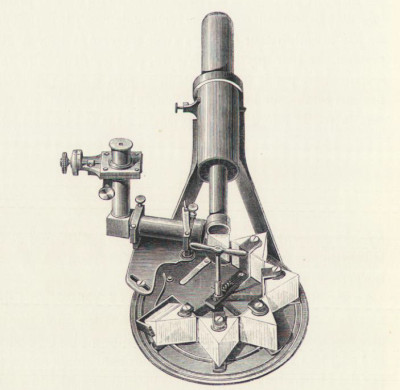
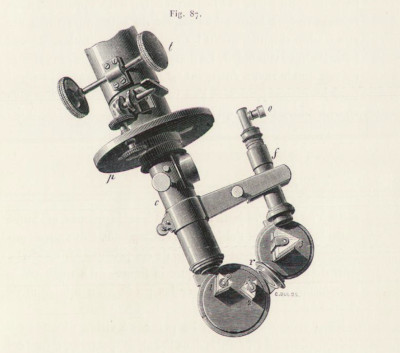
Fig. 4: Direct vision spectroscope, built by the Parisian optician Hoffman, used by Secchi to observe his first solar spectra in the early 1860's. Fig. 5, 6: Spectroscopes used by Secchi, as described in his book Le Soleil (1875), which combine a direct-vision prism with several angular prisms.
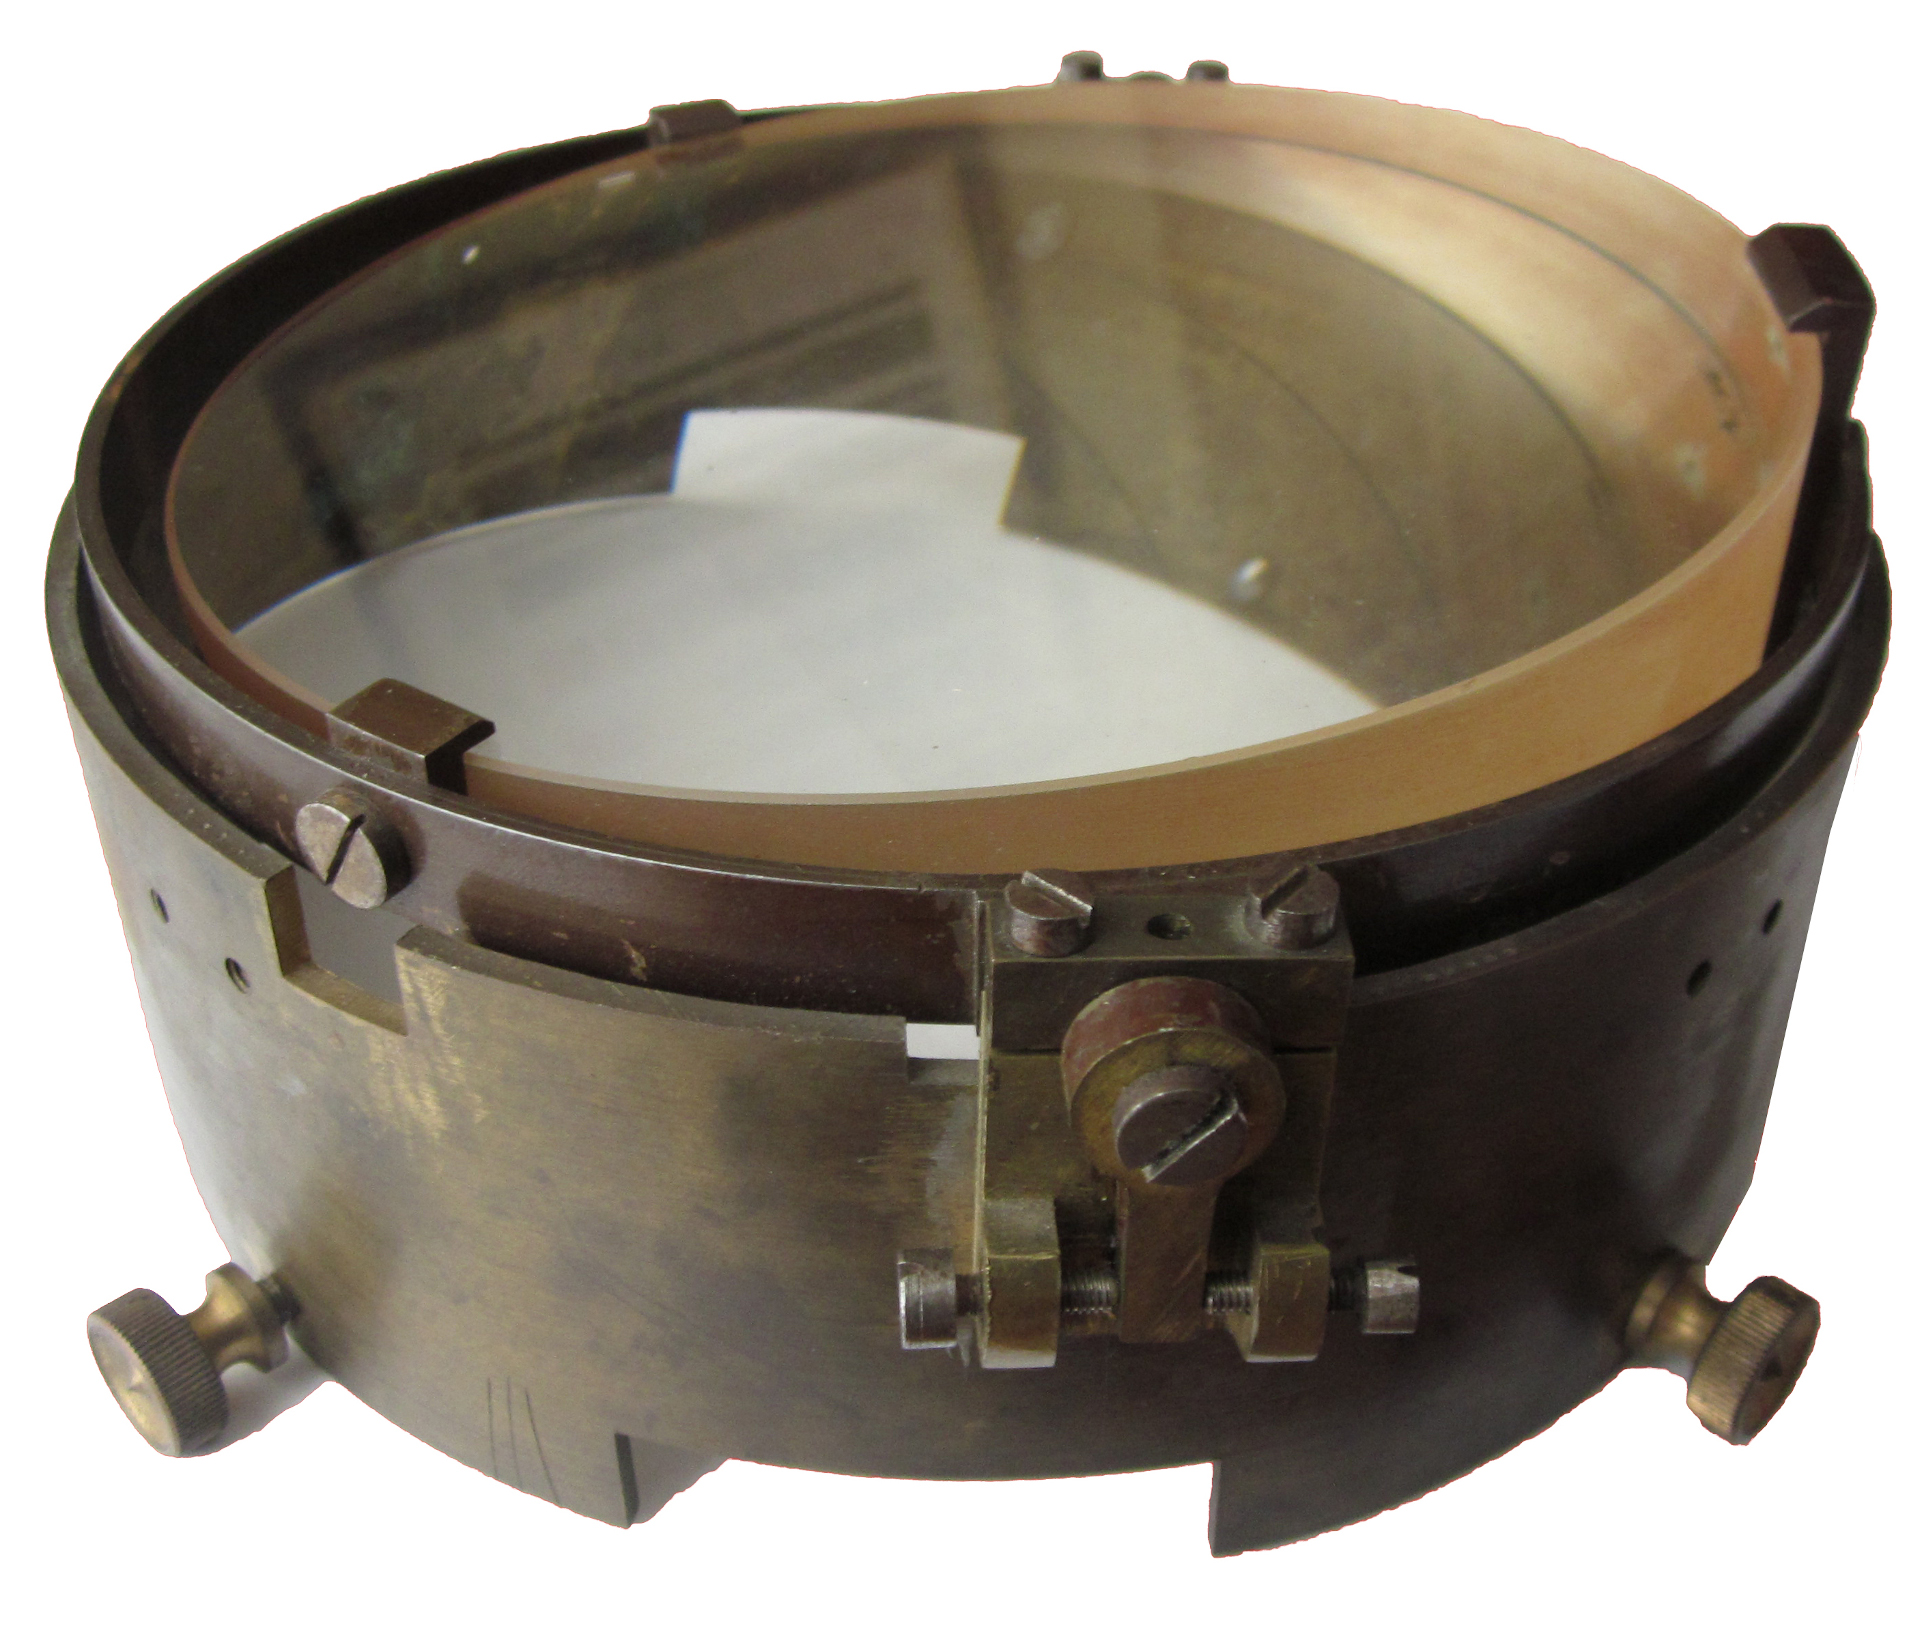
In 1869, Secchi sent to Merz his second memoir on the prismatic spectra, where he announced the identification of a fourth spectral class, and asked the German optician for an objective-prism. An objective prism is a transparent prism of small apex angle but large size that is placed in front of the objective of a telescope to cause all stars and other objects to appear as short spectra in the focal plane where they may be photographed together on a single plate of the field.
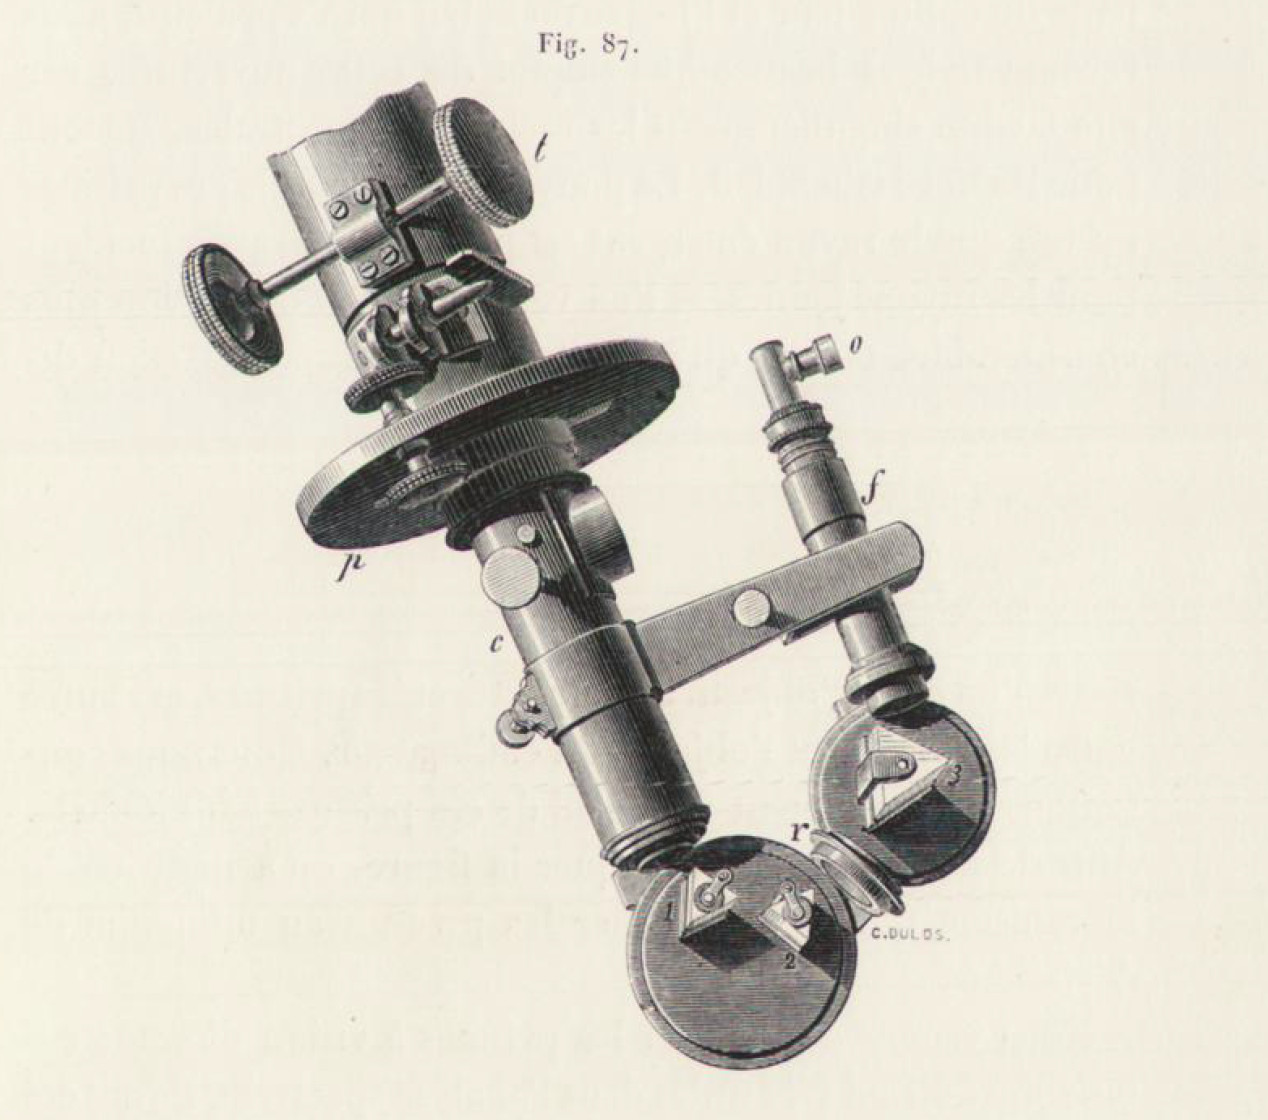
Angelo Secchi used the Merz objective prism on the 24-cm Merz refractor at the Collegio Romano observatory, and it soon became the main instrument for his spectral classification studies (see Figs. 7-9). Thanks to this instrument, Secchi was able to extend its original spectral classification, introducing up to a fifth class, comprising stars whose spectra have hydrogen lines in emission, such as Γ Cassiopeae.
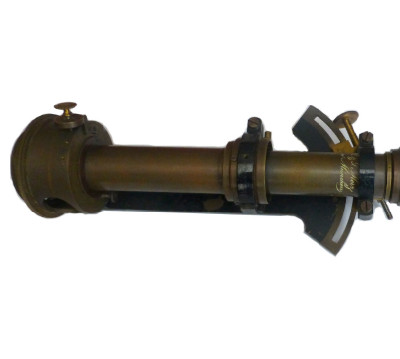
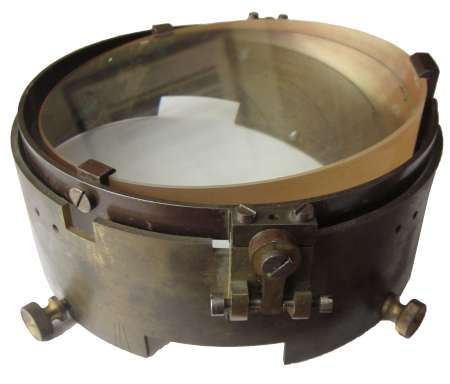
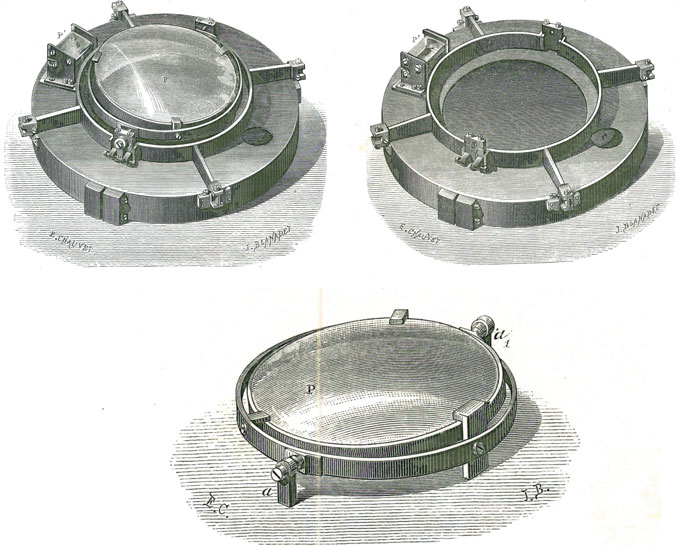
Fig. 7: Direct vision spectroscope with 5 prisms, built by Merz in 1863. Fig. 8: Prism objective by Merz (1864), initially equipped with a circular armature to position it on the lens of the Merz telescope, now inserted into a brass metal ring to adapt it to a Cauchoix telescope. Fig. 9: Objective prism and its mounting cell for the 24-cm Merz refractor at the Collegio Romano.
Supported by this equipment, Secchi was able to publish Le Stelle in 1877, his second major work after Le Soleil (first edition 1870, second edition 1875), leaving a lasting monument behind him. He classified at least 4000 stars, including most of the northern naked-eye objects plus a number of fainter stars down to eighth magnitude, and decisively influenced the future path of stellar spectral classification. By many sources he is therefore referred as the father of modern astrophysics.
Secchi's final classification system comprised five groups according to specific spectral characteristics:
Type 1: Comprises bluish-white stars with relatively simple spectra, which seem to be dominated just by a few, but very bold, lines. These turned out later to be the hydrogen lines of the Balmer series. This simple characteristic allows even beginners to roughly classify such stars into the currently used A or late B class (e.g. Sirius, Vega and Castor).
Type 2: Contains yellow shining stars with complex spectra, dominated by numerous metal lines, like those exhibited by the Sun, Capella, Arcturus and Pollux (roughly today’s classes F, G, K).
Type 3: Comprises reddish-orange stars with complex vibrational band spectra and just a few discrete lines. These broad, asymmetric absorptions reach the greatest intensity on the left, short-wave band end and are slowly fading towards the longwave (red) side. Such features show, for example Betelgeuse, Antares and Mira (today’s class M).
Type 4: Contains very rare, reddish stars with vibrational absorption bands, but their intensity fades towards the shortwave (blue) side (e.g. carbon star Z Piscium). Secchi already recognized that such features are generated by carbon.
Type 5: Comprises stars or nebulae with “bright lines” — emission lines as we know today.
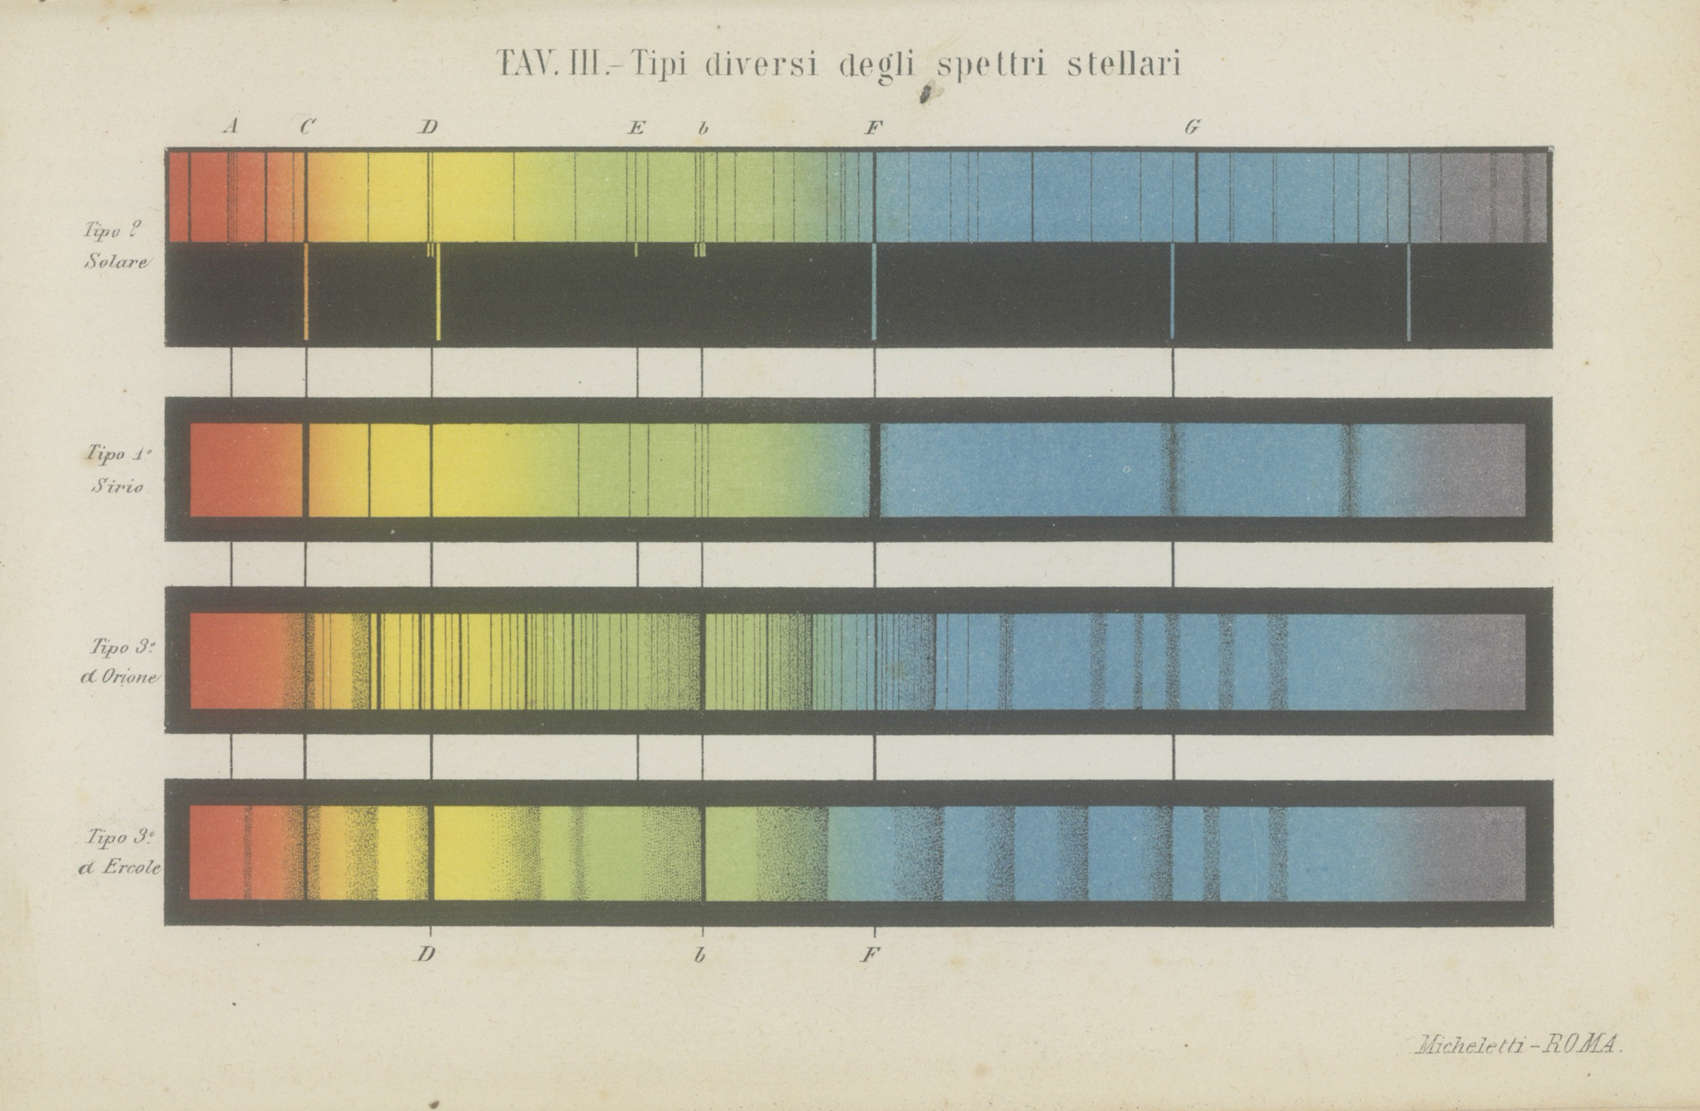
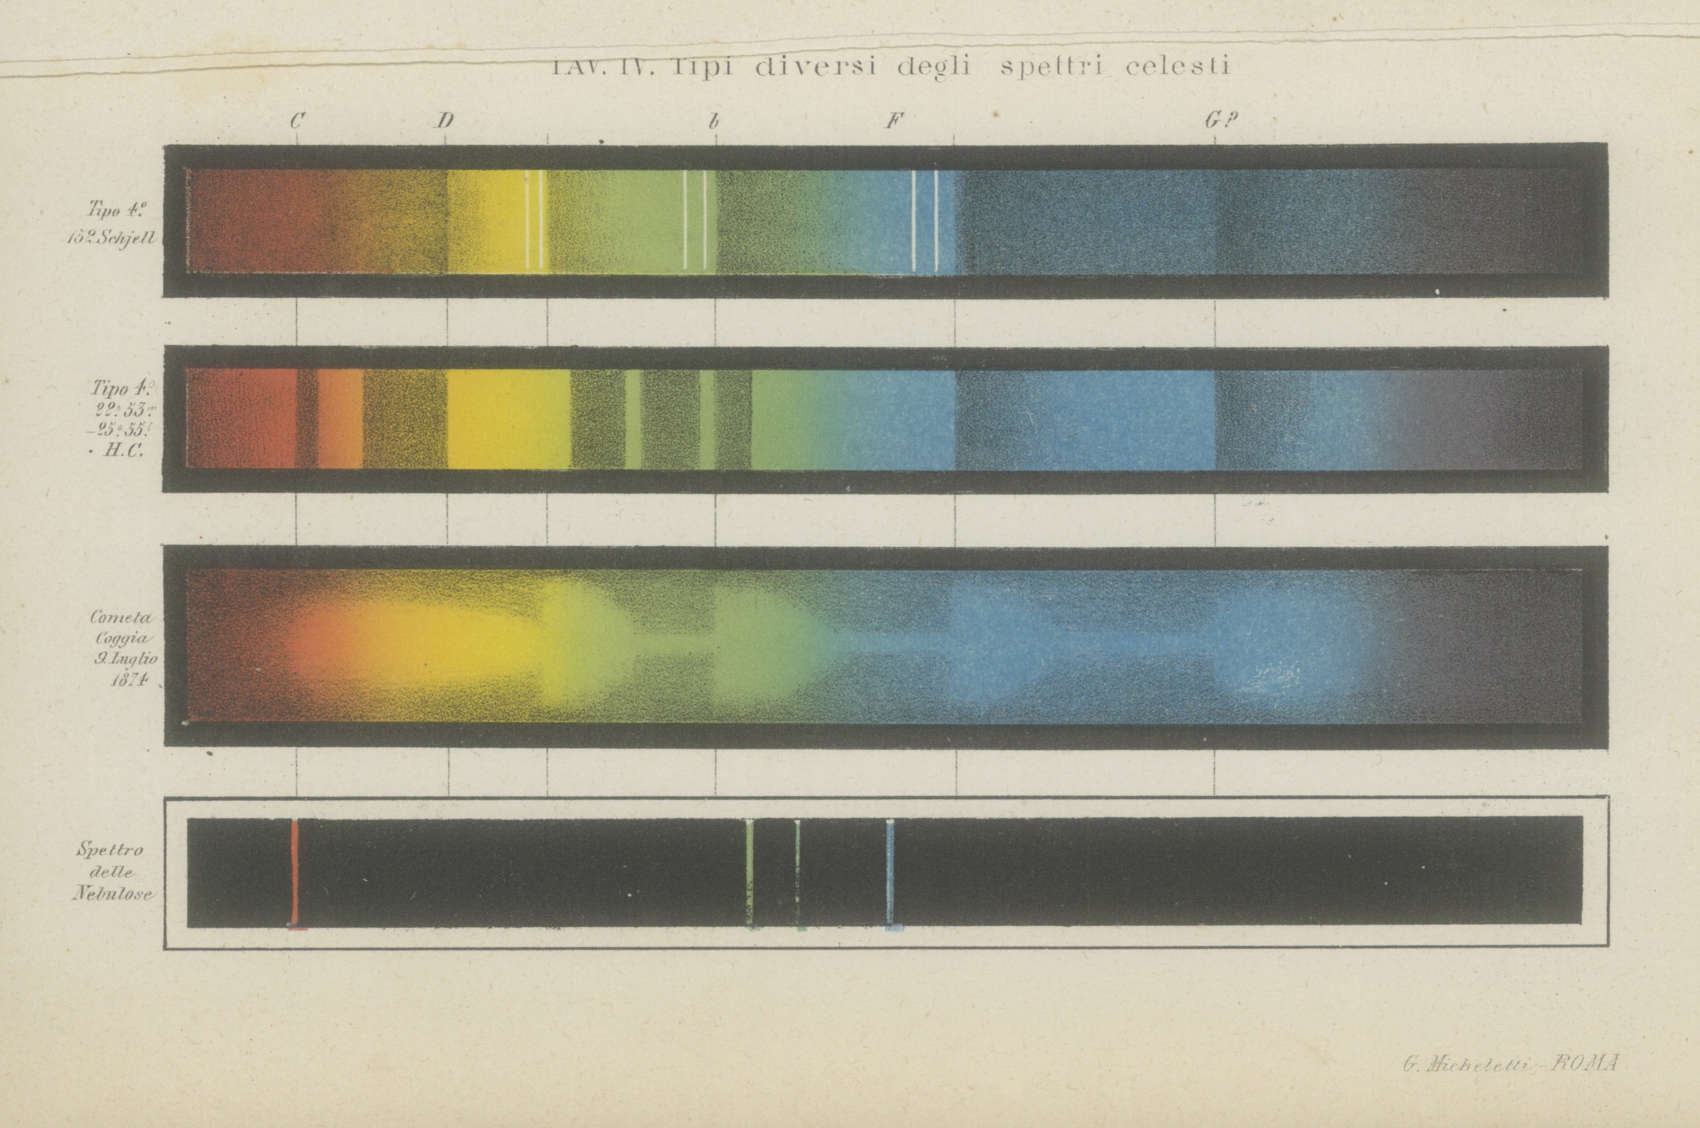
Fig. 10: Plates III and IV from Le Stelle (1877). Note that in Plate III the solar spectrum, typical of Type-2 stars, is now divided into photosphere and chromosphere: the photospheric spectrum shows the well-known Fraunhofer absorption lines, whereas the chromospheric spectrum presents four emission lines of hydrogen (later called Hα, Hβ, Hγ and Hδ of the Balmer series) and the yellow line of helium.
Spectral classification at Harvard and female computers
Many astronomers of the 1800s were able to do research only because of family wealth. One such astronomer was Henry Draper (1837–1882), an early pioneer of stellar spectroscopy who had in 1872 been the first to successfully photograph a stellar spectrum. After Draper died in 1882, his widow made a series of large donations to Harvard College Observatory for the purpose of building on his work. The observatory director, Edward Pickering (1846–1919), used the gifts to improve the facilities and to hire numerous assistants, whom he called “computers.” Pickering added money of his own, as did other wealthy donors.
Most of Pickering’s hired computers were women who had studied physics or astronomy at women’s colleges such as Wellesley and Radcliffe. Women had few opportunities to advance in science at the time. Harvard, for example, did not allow women to enroll as students and would not hire them as faculty. Pickering’s project of studying and classifying stellar spectra provided plenty of work and opportunity for his “computers,” and many of the Harvard Observatory women ended up among the most prominent astronomers of the late 1800s and early 1900s.
One of the first computers was Williamina Fleming (1857–1911). Following Pickering’s suggestion, Fleming classified stellar spectra according to the strength of their hydrogen lines: type A for the strongest hydrogen lines, type B for slightly weaker hydrogen lines, and so on, to type O, for stars with the weakest hydrogen lines. The Draper Memorial Catalogue with Fleming's classification of 10351 stars was published by Pickering in 1890. It was the most extensive and detailed spectral classification catalogue of the nineteenth century.
| Secchi type | Draper Memorial types |
|---|---|
| I | A, B, C, D |
| II | E, F, G, H, I, K, L (J not used) |
| III | M |
| IV | N |
Table 1: The relation between Secchi and Draper Memorial spectral types
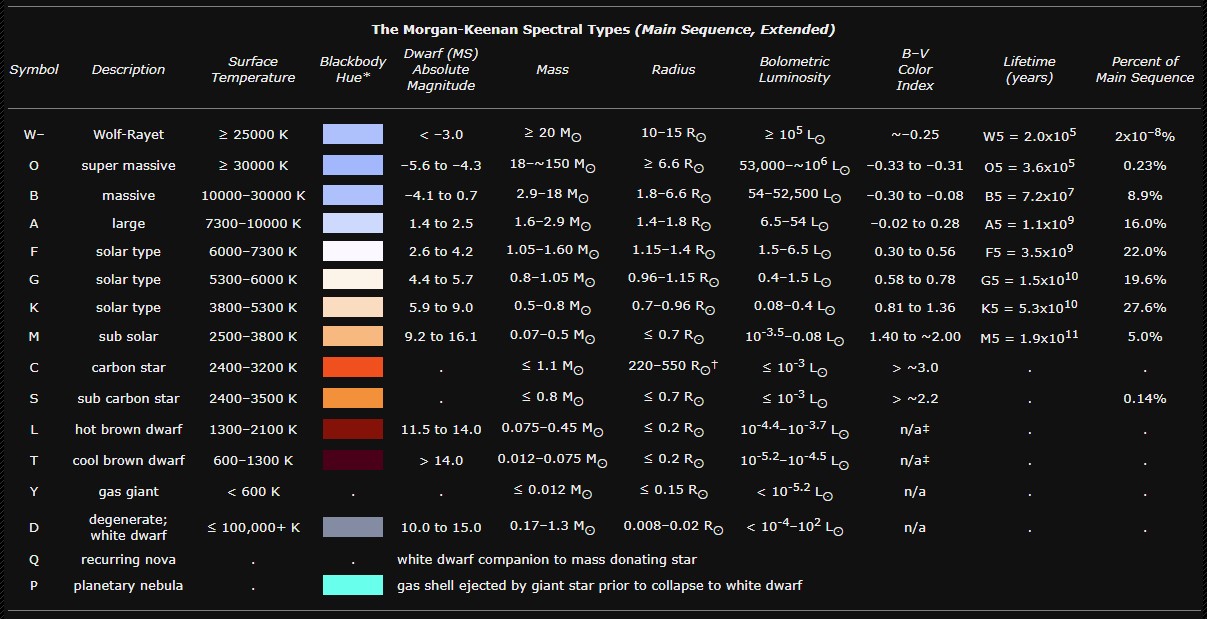
As more stellar spectra were obtained and the spectra were studied in greater detail, it became clear that the classification scheme based solely on hydrogen lines was inadequate. Ultimately, the task of finding a better classification scheme fell to Annie Jump Cannon (1863–1941), who joined Pickering’s team in 1896. Building on the work of Fleming and another of Pickering’s “computers,” Antonia Maury (1866–1952), Cannon soon realized that the spectral classes fell into a natural order—but not the alphabetical order determined by hydrogen lines alone. Moreover, she found that some of the original classes overlapped others and could be eliminated. Cannon discovered that the natural sequence consisted of just a few of Pickering’s original classes in the order OBAFGKM, and she also added the subdivisions by number.
Cannon became so adept that she could properly classify a stellar spectrum with little more than a momentary glance. In the course of her career, she personally classified more than 400,000 stars. She became the first woman ever awarded an honorary degree by Oxford University, and in 1923 the League of Women Voters named her one of the 12 greatest living American women. The astronomical community widely adopted Cannon’s system of stellar classification in around the end of World War I. Its basic structure has survived until today and is essentially based on the simple sequence of seven letters OBAFGKM. With this system, even today, still over 99% of the stars can be classified.
However, no one at that time knew why spectra followed the OBAFGKM sequence. Many astronomers guessed, incorrectly, that the different sets of spectral lines indicated different compositions for the stars. The correct answer—that all stars are made primarily of hydrogen and helium and that a star’s surface temperature determines the strength of its spectral lines—was discovered at Harvard Observatory by Cecilia Payne-Gaposchkin (1900–1979).
Cecilia Payne-Gaposchkin discovered that this sequence of letters follows the decreasing atmospheric temperature of the classified stars, starting from the very hot O types with several 10,000K down to the cool M types with just about 2400–3500 K. This so called temperature sequence reflects the recognition that the observed spectral features mainly depend on the photospheric temperature \(T_\text{eff}\) of the star and other parameters, such as chemical composition, density of the atmosphere, rotation velocity etc., are just secondary.
Relying on insights from what was then the newly developing science of quantum mechanics, Payne-Gaposchkin showed that the differences in spectral lines from star to star merely reflect changes in the ionization level of the emitting atoms. For example, O stars have weak hydrogen lines because, at their high surface temperatures, nearly all their hydrogen is ionized. Without an electron to “jump” between energy levels, ionized hydrogen can neither emit nor absorb its usual specific wavelengths of light. At the other end of the spectral sequence, M stars are cool enough for some particularly stable molecules to form, explaining their strong molecular absorption lines. Payne-Gaposchkin described her work and her conclusions in a dissertation published in 1925 that was later called “undoubtedly the most brilliant Ph.D. thesis ever written in astronomy.”
The MKK (Yerkes) and MK classification systems
Later on, progress in nuclear physics and the increasing knowledge about stellar evolution required a further adaptation and extension of the classification system. So it was recognized that within the same spectral class stars can exhibit totally different absolute luminosities, mainly caused by different stages of stellar development. Spectral lines are sensitive to stellar temperature and surface gravity, which again is related to luminosity.
Denser stars with higher surface gravity exhibit greater pressure broadening of spectral lines. The gravity, and hence the pressure, on the surface of a giant star is much lower than for a dwarf star because the radius of the giant is much greater than a dwarf of similar mass. In 1943, as another milestone, the classification system was extended with an additional Roman numeral by W. Morgan, P. Keenan and S. Kellmann from Mt. Wilson Observatory. This second dimension of the classification specifies the eight luminosity classes. Classes are described by:
- the same letters as the Harvard system, OBAFGKM
- the same arabic numeral for subclasses based on line ratios, A0, A1, A2, etc.
- a roman numeral for five luminosity classes between "I" and "V": The higher the number, the wider the lines
As a dwarf star the Sun is classified as G2V since it is still located on the main sequence of the HRD shining with the luminosity class V. Their system is summarized in their celebrated Atlas Of Stellar Spectra (see also this shorter PDF version). The atlas comprised 55 prints produced by Kellman (she was a photographic assistant at the Yerkes Observatory) displaying Yerkes 40-inch refractor slit spectra at the modest dispersion of 125 Å/mm, considered to be ideal for classifications of high accuracy. The outline of spectral classification accompanying the atlas carefully presented the classification criteria for each spectral type and decimal subtype. The spectral types were broadly based on the Harvard system, but the criteria were more precisely defined and a large number of standard stars given for each type.
After a decade's practical use of the MKK system, Johnson and Morgan published and extremely influential article in the Astrophysical Journal in 1953 with a number of cosmetic changes to tidy up the system. Most of this paper deals with defining the UBV system of photoelectric photometry (see also this post). Morgan had ten years earlier recognized the value of photometry in achieving a uniform system of spectral classification. He now formalized some small changes to the original MKK system of classification, some of which were already mooted earlier. For example, the early B supergiants were divided into classes Ia and Ib, some of the F giants were downgraded a class from III to IV and G and K giant standards were redefined to give a smoother (B − V) colour versus spectral-type relationship.
The resulting MK system has remained easily the most used spectral classification system until the present time, although further small changes were introduced in 1973 (referred to as the ‘revised MK system’) in their 1973 Annual Review article.
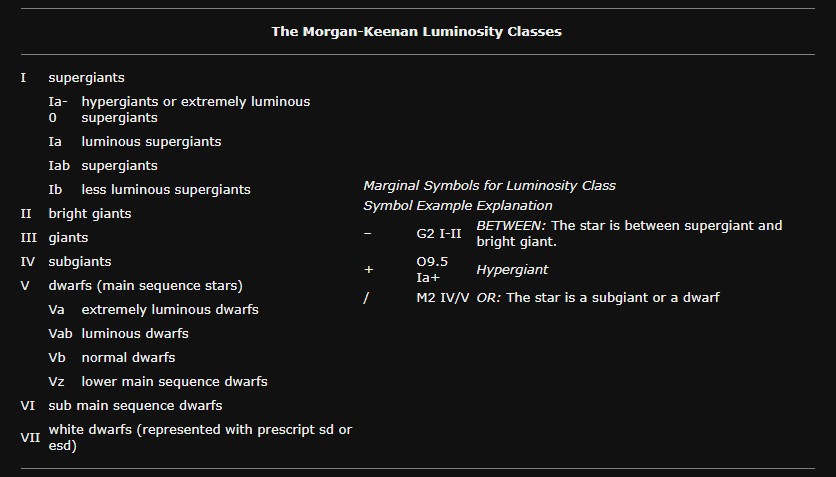
Fig. 12: Summary tables for the extended MK system (Source: Black Oak Observatory).
Sources and further reading
Angelo Secchi - Tra Cielo e Terra
Bennett, J., et al.: The Cosmic Perspective (Pearson 2014).
Chinnici, I. (Ed.): Merz Telescopes. A Global Heritage Worth Preserving (Springer International Publishing, 2017).
Hearnshaw, J.B.: Astronomical Spectrographs and Their History (Cambridge University Press, 2009)
Hearnshaw, J.B.: The Analysis of Starlight (Cambridge University Press, 2014)
Johnson, H. L., and Morgan, W. W.: Fundamental Stellar Photometry for Standards of Spectral Type on the Revised System of the Yerkes Spectral Atlas, The Astrophysical Journal 117, 313 (1953). [doi:10.1086/145697]
Morgan, W. W., and Keenan, P. C.: Spectral Classification, Annual Review of Astronomy and Astrophysics 11, 1 (1973). [doi:10.1146/annurev.aa.11.090173.000333]
Secchi, A,: Le Soleil. Exposé des principales découvertes modernes sur la structure de cet astre, son influence dans l'univers et ses relations avec les autres corps célestes (Gauthier-Villars, 1875) [https://doi.org/10.1098/rsta.2014.0213] [fulltext1] [fulltext2]
STARLIGHT. The origins of astrophysics in Italy. Exhibition 21 March - 21 June 2016, Italy
Walker, R.: Spectral Atlas for Amateur Astronomers (Cambridge University Press, 2017)